
Research overview
To accurately represent the formation and development of convections that may lead to storm- and flood-induced damage, it is important to calculate atmospheric flows with high accuracy because they transport heat and water vapor from near the ground surface to the atmosphere.
However, if we use conventional calculation methods, it is difficult to maintain a good balance between numerical accuracy and computational efficiency as the resolution becomes finer (i.e., with smaller computational grids).
Using a numerical method called the “discontinuous Galerkin method,” we attempted to improve the accuracy and efficiency of atmospheric flow calculation in meteorological models to estimate the probability of weather phenomena.
Details of research
To accurately represent atmospheric phenomena, it is necessary to calculate the atmospheric flow and associated heat and water vapor transport with high accuracy. Atmospheric flows, such as updrafts and turbulence, carry heat and water vapor from near the surface to the upper atmosphere and affect the formation and development of clouds.
Atmospheric flows are calculated based on the governing equations of "fluid dynamics". It is difficult to analytically solve the equations manually in order to obtain an exact solution. Thus, we divide the atmosphere into computational grids and calculate the approximate solution. There is a difference between the exact and approximate values. The errors decrease when the atmosphere is divided into finer grids. Here, the fineness of the grid is called “resolution.”
With the development of computers, the resolution of weather models has increased. We explore computational methods for fluid dynamics in meteorological models while considering a resolution of approximately 1 m for future atmospheric simulations near 2050.
The reduction in the errors with the increase in the resolution depends on the "order" of accuracy in the numerical method. For example, when the length of one side of the grid is halved, the error in the second-order accuracy becomes 1/2 squared (= 1/4), but the error in the third-order accuracy becomes 1/2 cubed (= 1/8)—the higher the order, the greater the error reduction.
Recent high-resolution atmospheric models have often adopted a numerical method called the "grid point method" with second-order accuracy. The error reduction with the second-order accuracy is small. When the resolution reaches approximately 1 m on one side of the grid, such conventional low-order methods are considered insufficient for accurately estimating the probability of weather phenomena. Therefore, we aim to improve the accuracy of fluid dynamics computations in meteorological models.
To simulate future atmospheric flow and temperature, it is necessary to calculate the slope of the spatial distribution (spatial derivative) of quantities that represent atmospheric states, such as flow, temperature, and water vapor. In reality, the spatial distribution of the atmospheric flow and the associated heat and water vapor transport are continuous and curvilinear. However, the second-order methods typically used in the meteorological models calculate the slope of the spatial distribution by assuming a linear distribution within the grid.
Even when the distribution in the grid is considered linear, the entire distribution gradually approaches a curve as the grid increases sufficiently. However, as long as the distribution within each grid is treated as linear, it slowly approaches a realistic curve. An extremely high resolution is required for the distribution to approach the curve.
Thus, how can we represent a realistic curvilinear distribution at a relatively low resolution? In the second-order grid-point method, only the information of the adjacent grid point is used to calculate the spatial derivative of the distribution at a given grid point. In this case, even if it is curved in reality, the distribution in the grid can only be expressed linearly because there is only information on two points in each direction. Therefore, to capture nonlinear features, we expand the collection of grids used for the calculation to obtain more information. Using this approach, we can represent the distribution within the grid as curvilinear, which is expected to be closer to the actual flow.

As the grid collection used for calculation expands, a wider range of data must be read from the computer's memory. There is a possibility of poor computational efficiency due to the requirement for the increased number of accesses to memory.
A supercomputer, such as “Fugaku”, consists of many small computers connected together. By dividing the large number of calculations among these small computers, we can rapidly perform the simulations.
To calculate the distribution within a grid based on the conventional grid point method, it is necessary to send and receive information between computers. The higher the amount of data is transferred between computers to improve accuracy, the higher the cost of data communication is between computers, and the lower the overall computational efficiency is.
Therefore, we focused on the “discontinuous Galerkin method” because it can accurately calculate the distribution within the grid based on relatively nearby grids. This method was originally developed in other scientific fields and was applied to atmospheric calculations approximately 10 years ago.
Even in the discontinuous Galerkin method, the calculation is performed for each grid, which is similar to the grid-point method. However, the discontinuous Galerkin method places points (nodes) within a grid. To represent the curvilinear distribution within the grid with high accuracy, we need only the values at the nodes and those just outside the targeting grid, which collectively calculate the slopes at all nodes in the grid. Thus, the requirements of the number of accesses to memory and the amount of data exchanged between computers are less than those of conventional grid-point methods. This feature allows for highly accurate computations with high efficiency.

Let us compare the conventional grid point method and the discontinuous Galerkin method with fourth-order accuracy.
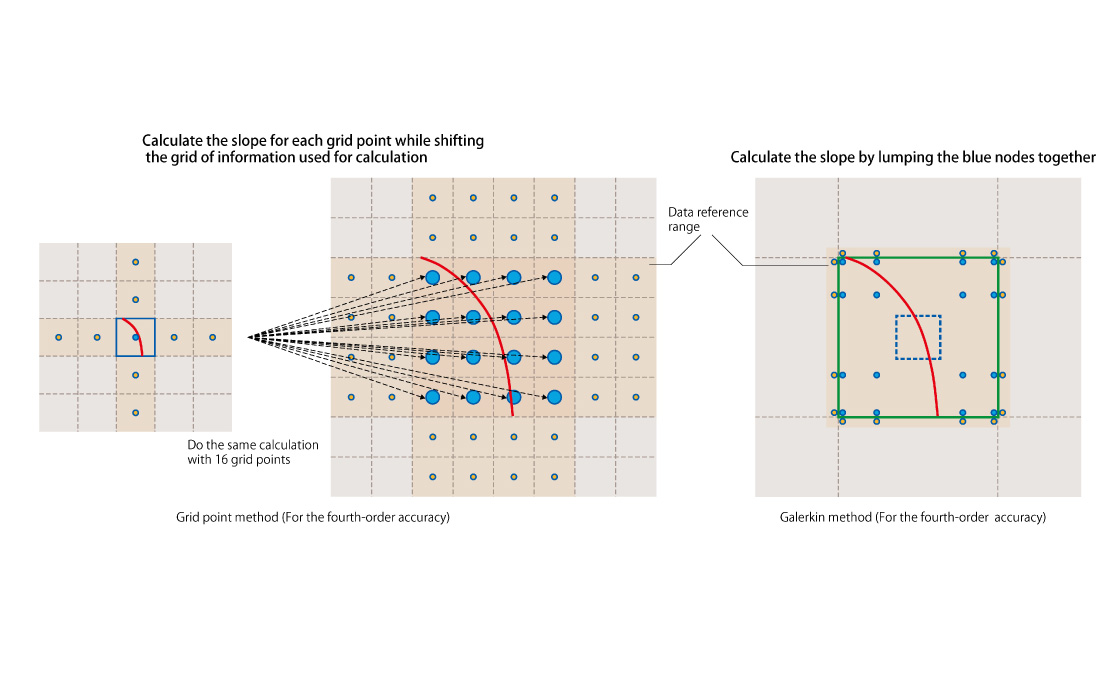
In the fourth-order accuracy of the grid point method, it is necessary to use the information of the eight grid points (yellow) on the left side of Fig. 3 to calculate the slope by considering the distribution in the blue frame to be curvilinear. A similar calculation is performed by shifting the collection of grid points. For example, similar calculations are repeated for 16 grid points to obtain the slope in the same region as the grid of the fourth-order discontinuous Galerkin method shown in the right panel of Fig. 3. Because each grid point is separately calculated on one computer or on different computers, the number of accesses to memory and the amount of data exchanged between computers increase, thus resulting in poor computational efficiency.
In contrast, the fourth-order accuracy of the discontinuous Galerkin method (Fig. 3, right) uses information at the nodes inside the grid (blue) and the yellow nodes just outside the grid. The blue nodes inside the grid can be grouped when the slopes are calculated. Because the calculations are performed collectively, this method requires fewer accesses to memory and less amount of data exchange between computers.
We aim to quadruple the computational efficiency using the discontinuous Galerkin method compared with the grid point method to accurately represent the distribution represented by eight or more grids in a simulation at a spatial resolution of approximately 1 m. Enhancing the accuracy and efficiency of the atmospheric flow calculations is expected to improve the probability estimation of weather phenomena.