
Research overview
Heat and water vapor, necessary for the formation of clouds, are supplied from the ground surface.
To reproduce the generation and development of clouds, it is necessary to accurately estimate the amount of heat and water vapor carried from the ground surface to the sky. The amount of transport is influenced by the chaotic air flow (“turbulence”) that occurs near the ground.
Turbulence may also exert a significant impact on the development and maintenance of tornadoes, which are extreme phenomena occurring near the ground surface.
Mouri and Ito (2022) derived a new calculation formula that can estimate turbulence transports of 1-m order near the ground surface, which is necessary for a 1-m resolution numerical model. The calculation formula was implemented in the new weather model developed in this project.
Details of research
The turbulence near the ground surface is caused by the frictional force at the boundary between the air and ground surface. Owing to turbulence, transports occur: the air near the ground surface is carried up, whereas the air above is carried down.
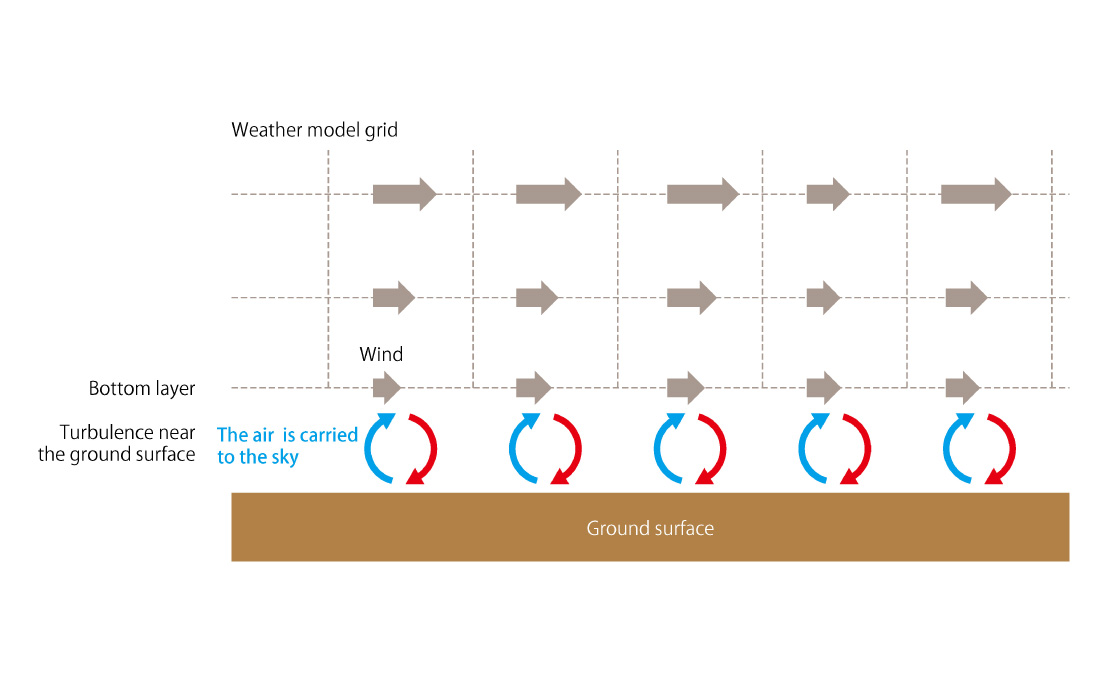
Heat and water vapor are transported upward, together with air. To estimate the amount of heat and water vapor near the ground surface (cloud components) carried above, it is necessary to calculate the amount of air on the ground due to turbulence.
However, calculating this amount is not straightforward. The scale of atmospheric turbulence ranges from the order of micrometers (1/1000 mm) to kilometers. A huge amount of computation is required to directly calculate turbulence based on the equation of motion, which is not possible even for a supercomputer.
Therefore, based on the analysis of experimental turbulence and field observation data, a calculation formula representing the relationship between wind speed near the ground surface and turbulence transport was derived and introduced into the numerical models. However, current equations may not be suitable when the resolution is fine.
However, a problem arises when the resolution becomes finer. Weather models are operative using numerical grids. In typical current weather models, grids have a resolution of several kilometers in the horizontal direction and several tens of meters in the vertical direction. The finer the spatial resolution is, the shorter the temporal scale to be considered in the calculations. In the current grids of several kilometers in the horizontal direction, turbulence is calculated based on its averages over several hundreds of seconds.
In the 2050s, the weather models for weather control are expected to have a spatial resolution of 1 m. Turbulence near the ground surface is also needed to estimate fluctuations of the order of 1 m. In a 1-m high-resolution weather model, it is necessary to introduce a formula that considers the relationship between wind speed and turbulence transport occurring near the ground surface with an average of less than 1 s.
To derive such a formula, Mouri and Ito (2022) utilized wind tunnel experimental data in order to measure the turbulence that occurs near the floor.
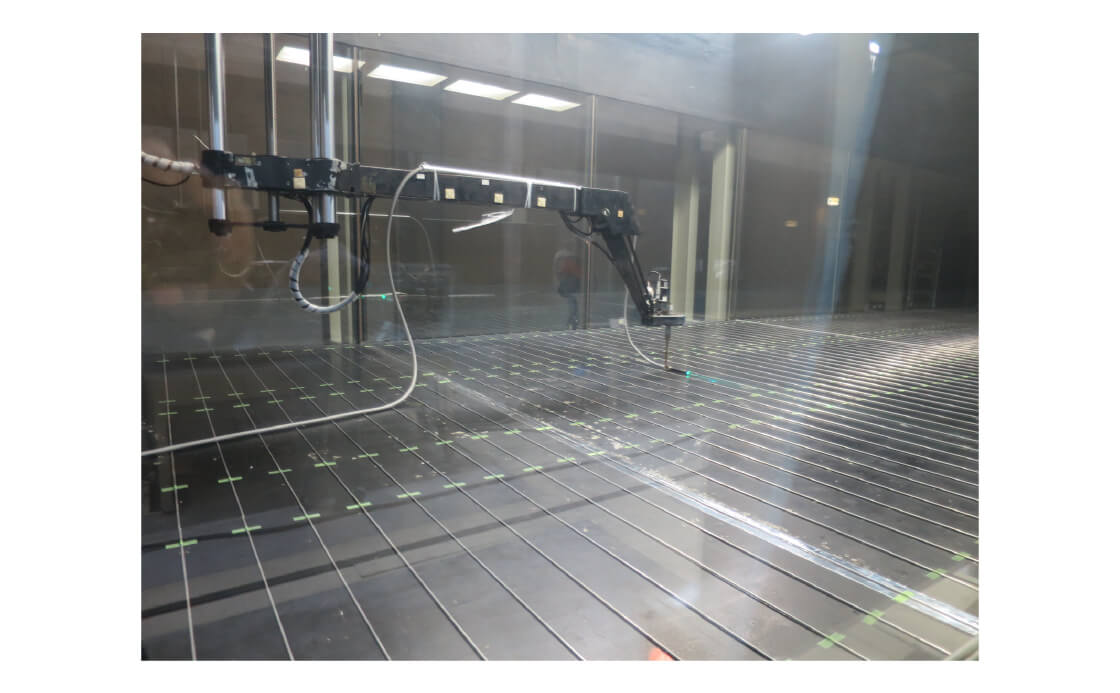
Figure 3 summarizes the data from the wind tunnel experiment, with the vertical axis representing the amount of upward turbulent transport from near the ground surface and with the horizontal axis representing wind speed. Green symbols indicate the measured data averaged over 5 s, while purple symbols indicate the data averaged over 0.5 s.

The conventional formula is indicated by the dashed light blue line. The dashed line shows that the stronger the wind occurs near the ground surface, the greater the turbulence transport is (the lower the vertical axis is, the greater the transport is).
The light blue symbols show data with an average value of several hundreds of seconds, which are handled via the typical current weather models. The light blue symbols represent dashed lines. The turbulence of that scale can be accurately estimated from the current calculation formula.
Many of the green symbols deviate from the dashed line, whereas the purple symbols deviate further. In the current formula, the estimation error of the 1-m-order turbulence is large. The finer the resolution is, the larger the error is.
Is there a precise equation of transport at a 1-m-order resolution? Dr. Hideaki Mouri (Meteorological Research Institute), who conducted this joint research with Dr. Ito, performed the fluid dynamic analysis and succeeded in formulating the relationship as presented in Figure 4. Symbols are the distribution of the experimental data of turbulence with averaged values over the order of 1 s, which is roughly distributed along a parabola-like curve of the new formula. The curve indicates that wind speeds that are weaker or stronger than those averaged over a sufficiently long time scale result in greater transport due to turbulence.
There was a large gap (error) between the straight line of the conventional formula and the data distribution. The new formula was able to reduce the error by approximately 50–70% relative to the conventional formula.

From the wind tunnel experimental data, Mouri and Ito (2022) succeeded in deriving a calculation formula that can estimate 1-s order turbulence near the ground surface, which is necessary for a weather model at a spatial resolution of 1 m. They are in the process of validating the calculation formula against field observation data of turbulence near the ground surface. The turbulence characteristics also change depending on the state of the ground surface, such as sea, land, forest, city, day, and night. The turbulence calculation formula must be adjusted considering such ground surface properties and the weather conditions.
In this project, we have developed a new weather model at a spatial resolution of 1 m or less. We plan on introducing a new formula into the weather model so as to reproduce cumulonimbus clouds and tornadoes as well as investigating the difference arising from the case of using a conventional formula.